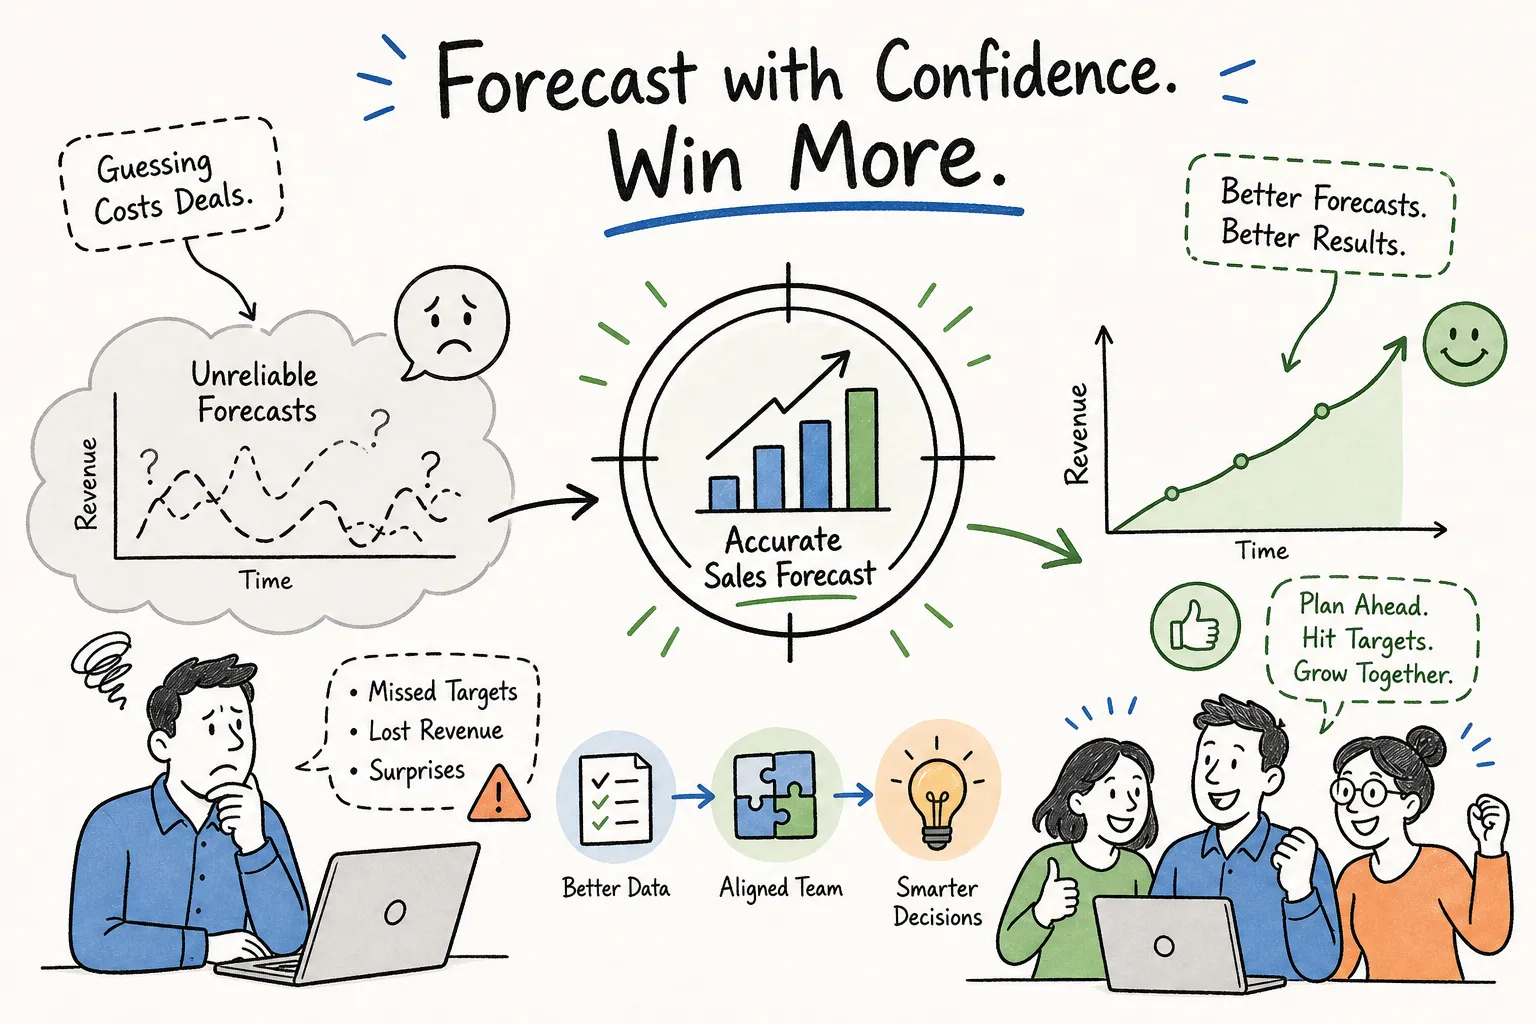
Sales forecast accuracy is a persistent problem for mid-sized B2B teams in India, and the numbers bear it out. Nearly two-thirds of B2B sales forecasts miss their quarterly targets globally, and in India the picture is starker still. Most mid-sized B2B teams here operate in the 60 to 70% quarterly accuracy range, meaning roughly three in ten forecast commitments are fiction by the time the quarter closes. The consequences are real: headcount decisions made on revenue that never arrives, pipeline resources misallocated across the wrong deals, and a CFO who quietly stops trusting the sales number the board receives. These are illustrative but widely recognised downstream costs of consistently poor forecasting discipline.
At Growth Aspire, we have coached forecasting teams across mid-sized B2B firms in India long enough to know this problem is almost always structural, not accidental. It is, in most cases, primarily a discipline and process problem, though gaps in systems and model design can also contribute. The root causes are identifiable and the fix is a workable playbook. This article covers those causes, three core methodologies for improving sales forecast accuracy, and a seven-step framework to move your team from gut-feel guessing to a revenue number you can genuinely defend.
Why mid-sized B2B sales forecasts keep missing the mark
The optimism bias problem
Rep-driven forecasts do not measure deal progress. They measure rep confidence. When a sales rep marks a deal as “commit,” they are typically responding to a verbal signal from the prospect, a positive meeting tone, or a relationship they feel good about. None of those things constitute buyer-side evidence of purchase intent. In India’s relationship-driven B2B market, this problem is compounded: a warm rapport is easily mistaken for a qualified opportunity, and managers rarely push back hard enough to separate the two.
The result is a forecast that reads more like a confidence survey than a revenue projection. Over-reliance on human judgement consistently ranks among the top root causes of forecast inaccuracy, and fast-growth markets only amplify the distortion. When pipeline optimism goes unchallenged at the rep level, it compounds at every roll-up until the number leadership presents bears little relationship to what the market will actually deliver.
Process gaps that hide in plain sight
Two structural failures appear in almost every mid-sized team we work with. First, stage definitions vary by rep: the same deal at the same point in the buying journey sits in different pipeline stages depending on who owns it, because no one has enforced a consistent definition of what belongs where. Second, there is no real-time performance-to-plan tracking, so forecast drift accumulates invisibly across weeks and surfaces only at month-end, long after any corrective action would have mattered.
The forecast does not fail at the end of the quarter. It fails at the beginning, when the inputs are dirty. No benchmarking exercise can improve forecast accuracy if the data entering the model is inconsistent from the start. These are upstream process failures, and that is precisely where the fix must begin.
Improving sales forecast accuracy with data hygiene
What poor data hygiene actually looks like
Poor data hygiene does not announce itself. It hides in patterns that are easy to overlook until you go looking for them: close dates that have not moved in 45 days, deal values updated only before quarterly business reviews, contact roles left blank across most of the pipeline, and stages advanced without any documented buyer action. Each of these is a signal corruption point. When a forecast model ingests corrupted inputs, the output is structurally flawed regardless of the model’s sophistication.
In India and across the APAC region, CRM data quality is a recognised challenge in sales operations benchmarking; see this CRM data hygiene guide. Fragmented CRM adoption, reliance on manual spreadsheets sitting alongside the CRM, and inconsistent field definitions across product lines all degrade forecast accuracy before a single calculation is run. The problem is rarely the forecast methodology. It is the raw material the methodology is working with.
A practical data hygiene standard for mid-sized teams
Clean data operationally means a short list of required fields that are defined, enforced, and audited, not left as optional. Close dates need an audit rule: as a working heuristic, flag any deal where the date has not changed in more than 30 days and the deal has not advanced stages. Stage progression should require a documented buyer action, not just a seller activity. If the rep sent a proposal but the prospect has not acknowledged it, the deal has not progressed from the buyer’s perspective.
Assigning a data steward role, even as a part-time responsibility within your sales operations function, closes the governance gap that most teams leave open. This is not about perfection. It is about reducing input variance so that forecast error reflects genuine market uncertainty rather than data chaos. When your error is structural and measurable, you can improve it. When it is noise, you cannot.
Pipeline stage discipline: the method most teams skip
Why entry criteria are not enough
Most sales organisations define what gets a deal into a stage. Entry criteria are relatively common. What almost no one defines is what must happen before a deal can leave a stage. That distinction is the specific mechanism that inflates pipeline and destroys weighted forecasts. Without exit criteria, reps advance deals based on their own optimism, and stage position becomes a lagging indicator of seller activity rather than a leading indicator of buyer commitment.
When your forecast weights pipeline by stage, those weights are only as reliable as the stage definitions themselves. A deal weighted at 60% because it sits in “Proposal” is meaningless if “Proposal” means five different things to five different reps. The number rolls up, the weighted forecast looks plausible, and then the quarter closes with a 30% miss. Exit criteria are not optional process hygiene. They are the structural prerequisite for any stage-based forecast to hold up.
Building outcome-based stage definitions
The distinction that matters most is between activity-based stages and outcome-based stages. “Proposal sent” is an activity. “Prospect confirmed the evaluation committee and requested commercial terms” is an outcome. Outcome-based stages are anchored in buyer behaviour, which makes them far more predictive of close probability. The same deal sitting in an outcome-based Evaluation stage carries meaningfully different weighted forecast value than one sitting in an activity-based stage carrying the same label.
Redesigning stage definitions is a one-time investment that pays a recurring dividend every time you run a forecast. It does not require new software or a six-month project. It requires a focused workshop with your sales leadership team, a commitment to enforcing the new definitions in CRM, and a weekly pipeline review process that holds reps accountable to objective buyer evidence rather than seller optimism.
Historical win-rate analysis: removing the guesswork
Sales forecast accuracy: stage-weighted win rates explained
Pull 12 to 18 months of closed deals from your CRM. For each pipeline stage, calculate how many deals that reached that stage eventually closed as won, divided by the total deals that entered that same stage. That percentage becomes your historical win rate for that stage. Apply it to current open pipeline rather than relying on rep-stated probability, and you have a weighted forecast grounded in actual performance rather than individual optimism.
A worked example makes this concrete. If your historical win rate from the Evaluation stage is 38% and you currently have ₹1 crore in deals sitting there, your weighted pipeline contribution from that stage is ₹38 lakhs, not the ₹1 crore the rep reports. Run that calculation across every stage, sum the results, and you have a revenue forecast accuracy figure that reflects what your pipeline has historically delivered.
To measure how accurate your weighted forecast actually is, two useful metrics are Mean Absolute Error (MAE) and Mean Absolute Percentage Error (MAPE). MAE gives you the average absolute gap between your forecast and actual revenue in rupee terms, straightforward and easy to track week on week. MAPE expresses that same gap as a percentage of actuals, which makes it easier to compare accuracy across quarters or deal segments of different sizes. For example, if your weighted forecast for the quarter was ₹50 lakhs and actuals came in at ₹42 lakhs, your MAE is ₹8 lakhs and your MAPE is 19%. Tracking these alongside Mean Absolute Deviation (MAD) and bias gives your team a complete picture of where your model over- or under-forecasts systematically. For further context on evidence-based approaches to forecasting, see this evidence-based forecasting study.
Why rolling win-rate analysis outperforms static benchmarks
Static win rates calculated once a year go stale quickly. Markets shift, competitive dynamics change, and buyer behaviour evolves in ways an annual snapshot never captures. A rolling win-rate model, recalculated each quarter on a trailing 12-month basis, stays current and reveals trends that flat annual numbers hide entirely. If your win rate from Proposal stage has dropped from 52% to 34% across three consecutive quarters, that is a signal to investigate deal quality and buyer engagement, not just rep activity volume.
Rolling win rates transform forecasting from a static snapshot into a dynamic diagnostic tool. When tracked alongside standard forecast error measurements like MAD and bias, they reveal systematic over-forecasting before it becomes a pattern the CFO notices. That early-warning capability separates teams that steadily improve their sales forecast accuracy from those who keep explaining the same quarterly misses.
Real-time deal signals: where gut-feel forecasting ends
The gap between methodology and execution
Even teams that adopt data hygiene practices, stage discipline, and win-rate analysis can still miss forecasts if their signal refresh rate is too slow. Monthly CRM updates mean forecast drift accumulates invisibly for weeks. A champion who went quiet in week two is invisible until the pipeline review in week four, by which point the window to intervene has closed. Think of early warning signals as concrete behavioural shifts: a drop in email response rates, a stakeholder who stops attending calls, or a close date slipping without a corresponding stage change. These are the leading indicators a static spreadsheet cannot surface. Detecting such operational drift is a production problem in its own right; practical guidance on detecting and handling data drift in production can help teams design reliable alerting thresholds and monitoring workflows.
How pipeline management tools close the loop
Deal intelligence platforms aggregate CRM data, engagement signals, and deal activity to surface leading indicators rather than lagging ones. Purpose-built platforms designed for mid-sized teams, including Growth Aspire’s Deal Intelligence platform, provide the real-time signals needed to flag at-risk deals before the forecast is already committed. Several tools exist in this category; the key is choosing one that integrates cleanly with your existing CRM and surfaces actionable alerts rather than raw data. Methodology is necessary, but not sufficient on its own. Execution speed determines whether the methodology actually protects the number when it matters most. For a technical look at pipeline-level solutions, read more about pipeline forecasting, or download our whitepaper on building intelligence into your deal pipeline to see how these concepts map to mid-sized B2B workflows.
A seven-step playbook to improve sales forecast accuracy
Most mid-sized teams can work through the first five steps within approximately 60 days. Steps 6 and 7 embed the monitoring discipline that prevents regression once early improvements take hold.
- Define exit criteria for every pipeline stage. Make them outcome-based and buyer-anchored. Document them, train the team, and enforce them in CRM before a deal can advance.
- Audit your required CRM fields. Identify the five to seven fields your forecast model depends on and make them non-optional. Use CRM validation rules to enforce completion at each stage transition.
- Assign a forecast data owner. This person reviews pipeline data quality weekly, flags stale close dates, and holds reps accountable for timely, accurate deal updates.
- Calculate historical win rates by stage. Use 12 to 18 months of closed deals. Segment by deal size or product line if those variables materially affect conversion behaviour in your market.
- Build a weighted forecast model. Replace rep-stated probability with stage-based historical win rates. Recalculate the model on a rolling quarterly basis to stay current with market conditions.
- Establish a weekly forecast review cadence. Review the weighted forecast against plan every week, not every month. Deal with slippage while it is still recoverable, not after the quarter has closed.
- Set a drift alert threshold. Define the variance level that automatically triggers a forecast update and a management review, for example, a 10% deviation from the prior week’s weighted forecast is a reasonable starting point to tune for your business.
Teams that implement all seven steps often see meaningful improvements in revenue forecast accuracy over subsequent quarters. The gains compound as win-rate data matures and stage discipline becomes habitual across the team. Understanding common causes of forecast inaccuracy can help you prioritise which of the seven steps to tackle first. These approaches can typically be implemented without enterprise AI projects or a dedicated data science function, though the effort and timeline will vary by team size and CRM maturity, or supported by a focused platform such as our Sales Engine OS.
Conclusion
Sales forecast accuracy does not suffer because forecasting is inherently hard. It suffers because the inputs are dirty, the process is inconsistent, and the signals arrive too late to act on. None of these three areas, data hygiene, pipeline stage discipline, and historical win-rate analysis, requires enterprise software or a dedicated data science function. They require discipline and the willingness to anchor your revenue forecast accuracy in buyer evidence rather than seller confidence.
When these foundations are in place, the downstream effects are significant: shorter sales cycles, sharper resource allocation decisions, and a revenue number the board actually uses rather than quietly discounts. The CFO stops questioning the methodology and starts making decisions based on it. That shift from scepticism to confidence is what structured forecasting discipline produces, quarter after quarter.
If your team is ready to move beyond the current cycle of quarterly misses, Growth Aspire works with mid-sized B2B sales teams across India to implement these frameworks with hands-on, structured support. The seven-step playbook above is a strong starting point. If you want a practical starting guide, see our article on planning your sales revenue and resources using analytical tools. Our workshops and coaching programmes take teams through the full implementation with accountability built in at every stage, book a workshop to improve your sales forecast accuracy and start the next quarter with a number you can defend.
Signup for the our upcoming Deal Intelligence Project Where we share you the exact blueprint for enterprise sales